Sync up your clocks! Better PTP settings on Raspberry Pi
PTP on Raspberry Pi, it’s
apt install linuxptpand done, right?
Maybe not. Here are some tips to run it better than the default settings.This article is part of a series about inastitch.
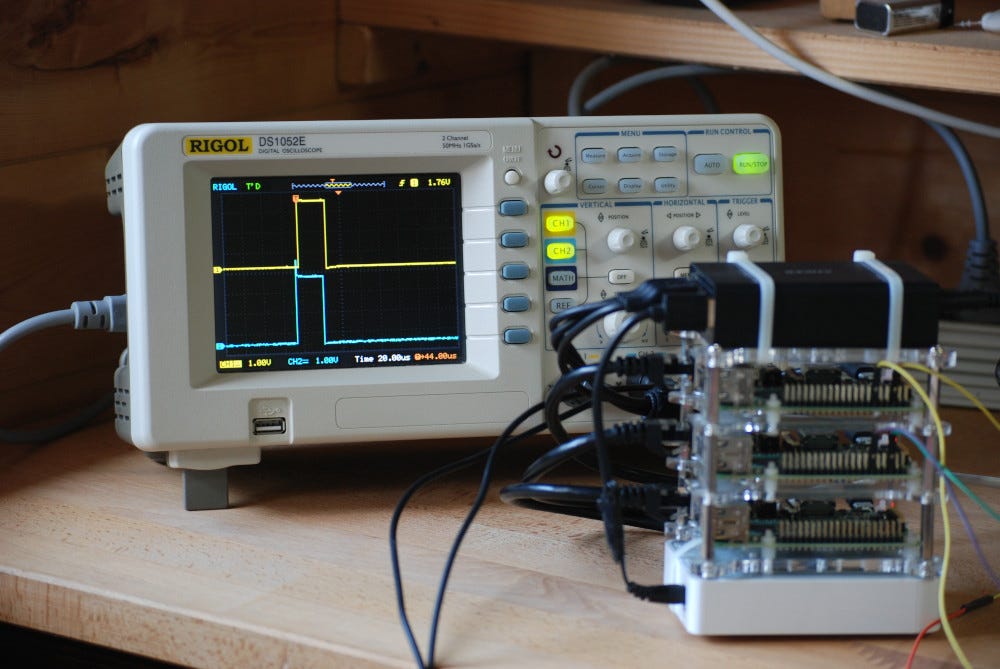
In this project, clock synchronization is critical for frame capture alignment.
It all started with this git repo of patches to make PTP work on Raspberry Pi 3: https://github.com/twteamware/raspberrypi-ptp. Those patches are now integrated in the official release of RPi OS.
The page performance.md is the most interesting. It compares the clock sync quality between a RPi3 (with software timestamping) and a NXP iMX7 (with hardware timestamping).
Result: RMS offsets are close, but min/max offsets are one order of magnitude larger for the RPi3. This is to be expected from software timestamping.
First question: how do I generate those nice little graphs?
How to plot PTP metrics?
Extract ptp4l logs from journalctl -u ptp4l.service, process the log lines with a regular expression and python, and plot the data with good old gnuplot.
python
# Parser script to plot PTP delay
# Vincent Jordan
# 2020.10.12# Run with:
# journalctl -u ptp4l.service | grep "master offset" | python3 parse_ptp.pyimport re
import fileinput
import sysminKernelTime = 0;
maxKernelTime = 1000;pattern = '^(.+)ptp4l\[[0-9]+\]: \[(.+)\] master offset\s+(-?[0-9]+) s([012]) freq\s+([+-]\d+) path delay\s+(-?\d+)$'
test_string = 'Oct 20 11:44:18 raspberrypi ptp4l[353]: [27.058] master offset 1169073126895 s0 freq      +0 path delay    267760'# Gnuplot data header
print('# time, offset, freq, pathDelay')for line in fileinput.input():
    # Regex search
    res = re.search(pattern, line)# if pattern was matched
    if res:
        # Capture result
        timeAndHost  = res.group(1)
        kernelTime   = res.group(2)
        masterOffset = res.group(3)
        state        = res.group(4)
        freq         = res.group(5)
        pathDelay    = res.group(6)    if (state == '2') and (float(kernelTime) > minKernelTime) and (float(kernelTime) < maxKernelTime):
            print(kernelTime, masterOffset, freq, pathDelay)

    # if issue in patter
    else:
        print("Regex error:", line)
        sys.exit()
gnuplot
# Output in PNG image file
set term png
set output "output.png"set xtics font "Verdana,10"
set ytics font "Verdana,6"# for multiple plot in one image
set multiplot
set size 1, 0.3set origin 0.0,0.6
plot 'ptp.dat' using 1:2 with lines title 'offset' lc 'black'set origin 0.0,0.3
plot 'ptp.dat' using 1:3 with lines title 'freq' lc 'black'set origin 0.0,0.0
plot 'ptp.dat' using 1:4 with lines title 'pathDelay' lc 'black'
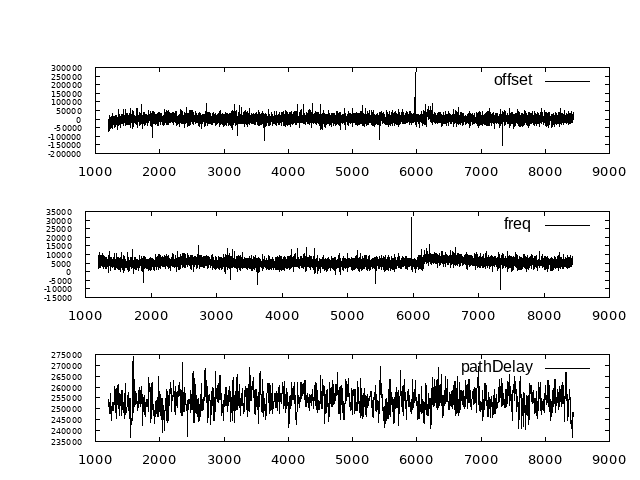
Result

It takes around 1200 seconds (20 minutes) to sync the clock from a cold start.
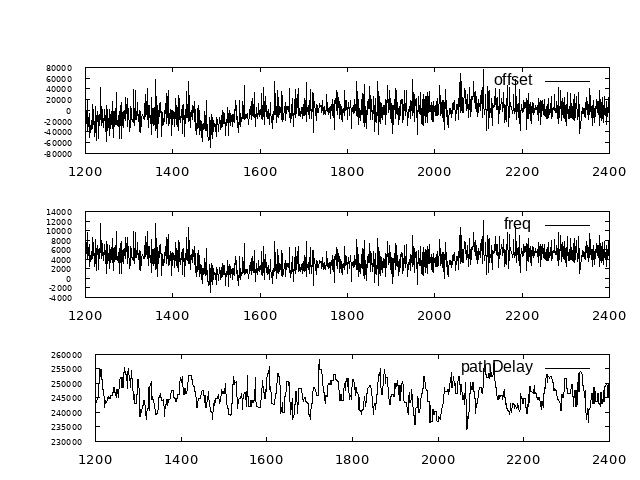
After 20 minutes, the clock offset is pretty stable between ±80µs.
Perfect, because under 100µs is what we need for inastitch to work. Let’s connect everything…
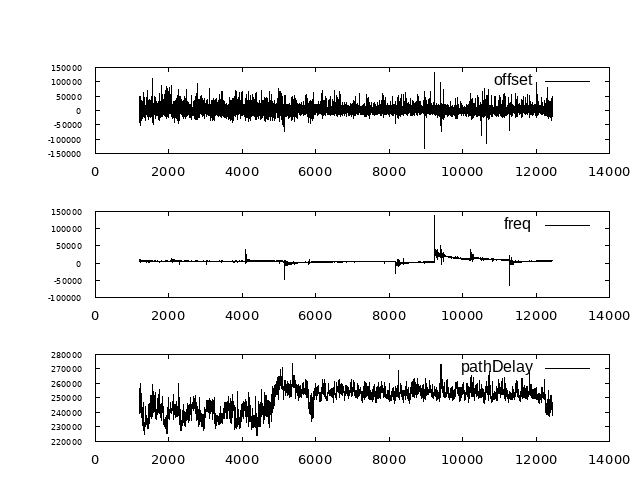
Put everything together, and what the…?
Now it’s time to connect the stitcher board and start streaming.

Can you guess when the stitcher board was connected? Yes, at kernel time 3800. It created a massive instability of the network path delay resulting is large clock offsets…
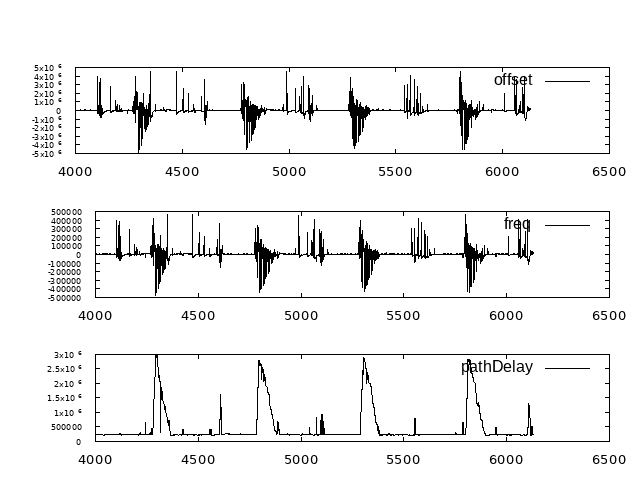
Even long after streaming started, PTP suffers from seemingly cyclic delays. This unstable clock is not good enough anymore for stitching.
Solution 1: Use a dedicated network
Using a dedicated network switch will let PTP run free from interference. In a more professional setup, instead of a redundant switch, PTP traffic would run in a different vlan with high priority in order to minimize latency. AVB/TSN networks have special support for PTP built-in.
On a dedicated network:

After 20 minutes, the clock offset is pretty stable between ±80µs like before. Start streaming and not difference is visible in PTP sync… 🙌
When running for 2 hours, spikes are still visible.
Solution 2: Use a different clock servo
In the newer version of ptp4l, there are two options for clock_servo:
piis the default option. It’s accuracy depends on the pi constants (i.e., all the options starting withpi_in the config file).linregis a newer option which does not reply on hard-coded constants.
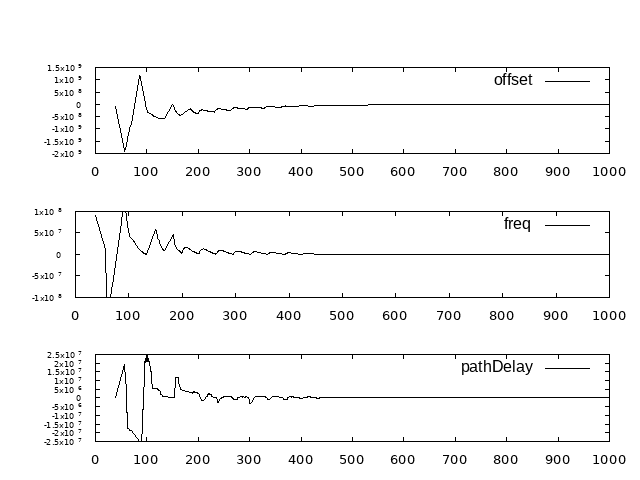
Let us try linreg instead of pi.
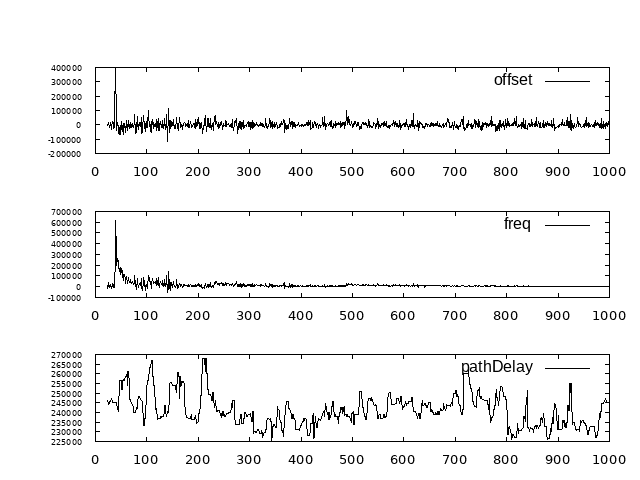
PTP stabilization is much quicker with linreg, and after many hours, the clock still looks more stable, see below:

Other ideas which do not seem to change much, or are not possible
kernel dynamic ticks
The kernel option nohz=off tells the kernel to disable dynamic ticks. Dynamic ticks helps the kernel to let the CPU longer in sleep states. By disabling this power-saving feature the system clock is expected to be of higher accuracy.
Modern kernel should mitigate this issue, and little difference is seen in real-life between nohz=off and nohz=on.
Note: nohz=off was set in all the tests above.
sync frequency
In the configuration file /etc/linuxptp/ptp4l.conf, there are option to change the frequency of the cyclic sync and delay request messages:
logSyncIntervalis “the mean time interval between Sync messages. A shorter interval may improve accuracy of the local clock” (quoting the man page)logMinDelayReqIntervalis “the minimum permitted mean time interval between Delay_Req messages. A shorter interval makes ptp4l react faster to the changes in the path delay” (quoting the man page)
Both settings are specified as a power of two in seconds. For example, 0 is two power zero = 1 second.
Negative values seem to be accepted for intervals below 1 second, and should result in update rate higher than 1s.
P2P instead of E2E
In /etc/linuxptp/ptp4l.conf, the option delay_mechanism can be changed to P2P (Peer-to-Peer) instead of E2E (End-to-End, default).

P2P cannot be used with legacy switches.
This slide comes from a nice introduction to PTP by NetTimeLogic, see references for the full presentation.
References
NetTimeLogic introduction to PTP:
https://www.nettimelogic.com/resources/PTP%20Basics.pdf
Fedora Project documentation about PTP:
https://docs.fedoraproject.org/en-US/fedora/rawhide/system-administrators-guide/servers/Configuring_PTP_Using_ptp4l/
ptp4l man page:
https://manpages.debian.org/unstable/linuxptp/ptp4l.8.en.html

